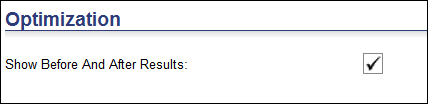
Users can view and compare optimization results before and after certain processes are completed when the Show Before And After Results setting is enabled on the Data Filters > Options page.
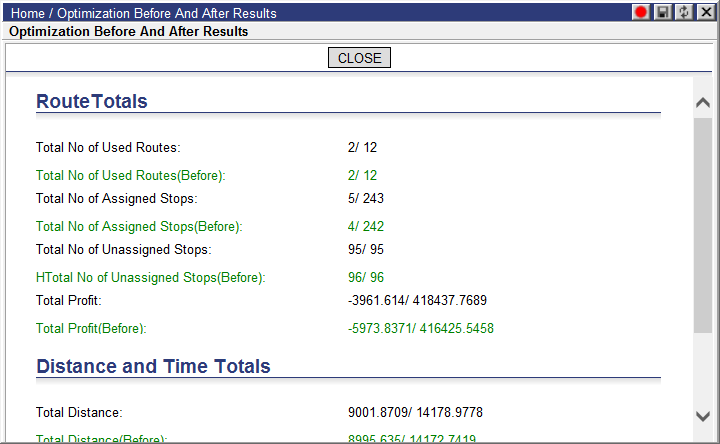
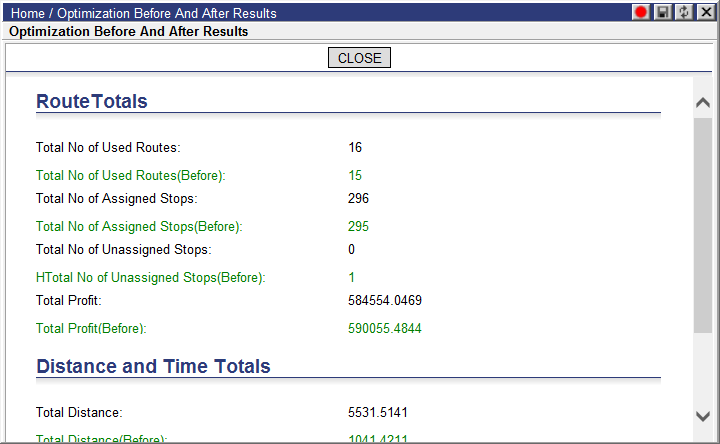
After each of the following actions, users can press CTRL-G on the Dashboard to display route, time and distance metrics before the operation and after the operation in the Optimization Before and After Results window.
• Optimize All, Optimize Selected, Optimize Selected Stops
• Drag and Drop (manual assignment)
• Unassign All Stops, Unassign All Stops on All Routes
• AutoAssign, AutoAssign All, AutoAssign to Selected
• Resequence
• Reverse
• Suggest, Suggest Orders
The metrics displayed are:
• Total No of Used Routes
• Total No of Assigned Stops
• Total No of Unassigned Stops
• Total Profit
• Total Distance
• Total Time Driven
• Total Elapsed Time
If a filter is applied, the Optimization Before And After Results window will display the Route, Distance and Time Totals values accompanied by the number of displayed routes compared to the number of total routes depending on the filter.